FoxCloud
Frequentation Analysis Solutions
Cloud
Solution
People
Counting
Analysis
by Periods
Analysis
by Site
Line
Density
Typical
Day
KPI
Definition
FoxCloud is the latest innovation from Foxstream and will be released in September 2016. It will allow users to access counting data for several sites in one dedicated user interface. FoxCloud will enable you to:
- Show counting results for one or more sites
- Configure displayed data per site, per period, etc.
- Compare counting data per site (in/out)
- Compare several periods for the same site
- Display KPIs
- Access data from anywhere and at any time
Application
Examples
Determination of a Typical Day
The data allow you to summarize a typical day or week so that you can adapt your resource planning accordingly
Frequentation Comparison between Sites
Ranking of most frequented sites to identify possible problems
KPI Definition
Define Key Performance Indicators to create a reference base
Downloads
And More…
-
Schedule a Presentation
Schedule a Demonstration
Would you like to learn more about our products or see specific applications? Please fill out the following form and it’ll be our pleasure to reach out to you and schedule a personalized demonstration.
-
Find a Distributor
Find a Distributor
Let us help you to find the best channel possible for your needs by filling out the following form.
-
Free Test of our Products
Test our Products
The proof in the pudding is eating it… Would you like to test our products in your setting? Please fill out the following form and we’ll make it happen.
-
Start a Feasibility Study
Feasibility Study
Help us to help you! If you’d like to have a comprehensive feasibility study for your project, please tell us as much as possible about it. We will provide you with a complete study based on our FoxTool application, indicating the number of cameras, their coverage areas, and much more information. We’ll even come out to your site, if required. Once completed, we will add a clear quotation to help you visualize clearly your project and avoid any surprises.

Comparative Data
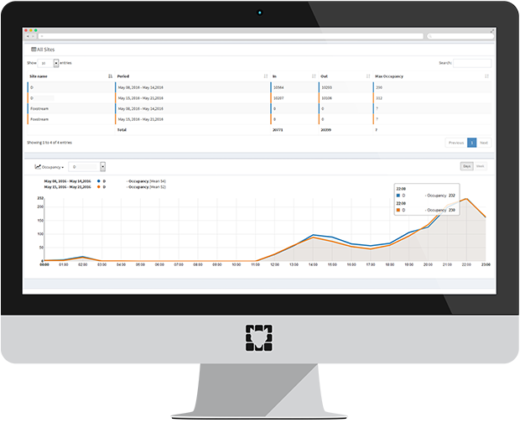
It is possible to compare:
- A single site over configurable predefined periods
- Several sites based on the same period
- Several sites over configurable predefined periods
You can also define a typical day or week based on the data generated.


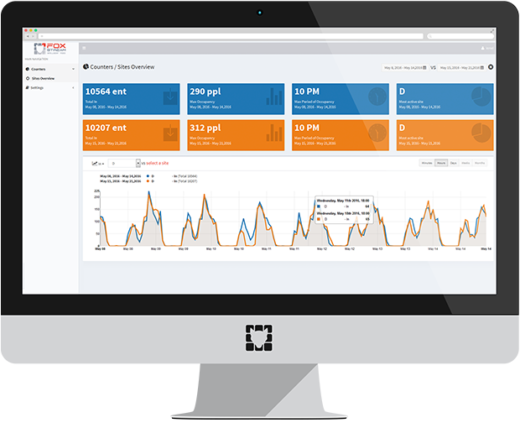
Key Performance Indicators
The 4 key indicators are displayed at the top of the page in order to provide a quick overview of the selected site:
- Total number of entries during a period
- Maximum number of people attained in the selected site
- Peak hour of affluence
- Site with the most frequentation during the time period

Comparative Data
It is possible to compare:
- A single site over configurable predefined periods
- Several sites based on the same period
- Several sites over configurable predefined periods
You can also define a typical day or week based on the data generated.


Key Performance Indicators
The 4 key indicators are displayed at the top of the page in order to provide a quick overview of the selected site:
- Total number of entries during a period
- Maximum number of people attained in the selected site
- Peak hour of affluence
- Site with the most frequentation during the time period


Comparative Data
It is possible to compare:
- A single site over configurable predefined periods
- Several sites based on the same period
- Several sites over configurable predefined periods
You can also define a typical day or week based on the data generated.


Key Performance Indicators
The 4 key indicators are displayed at the top of the page in order to provide a quick overview of the selected site:
- Total number of entries during a period
- Maximum number of people attained in the selected site
- Peak hour of affluence
- Site with the most frequentation during the time period

Information
Technical Specifications
Operates under Microsoft Azure
Cameras: IP Axis or Samsung cameras compatible with FoxCounter
Maximum number of cameras: unlimited


 FR
FR EN
EN ES
ES IT
IT